The Custom-Pak approach to environmental responsibility is to go above and beyond expectations wherever possible, to live up to the aspirations of our community and the reality that the planet’s resources are finite.

In the past, some players within the thermoforming sector have attracted criticism for a blasé attitude to resource use. The old model of production used raw materials in a linear fashion that mined raw materials, used them, then disposed of the used product to landfill. In this approach, there was very little consideration given to the sustainability of the system, or the impacts on communities at the end of the line. Negative environmental impacts of this approach included the high amount of waste generated, the cost of waste disposable to landfill, and the fact that the bill for landfilling these materials would be typically paid by communities through their council rates. This linear model of plastic packaging manufacturing also used up finite resources more quickly than necessary, making it unsustainable in the long term.

Thankfully, this tunnel vision has now given way to a broader acknowledgement that we’re all part of a wider system and the environment is what ultimately sustains us. To support this more positive approach to business, Custom-Pak are full members of Plastics New Zealand, an organisation that works to influence plastic thermoforming in New Zealand, so that thermoformers behave in an environmentally responsible manner. We fully support the need for everyone to play their part and become responsible stewards, especially when it comes to our use of raw materials and how much waste we generate.
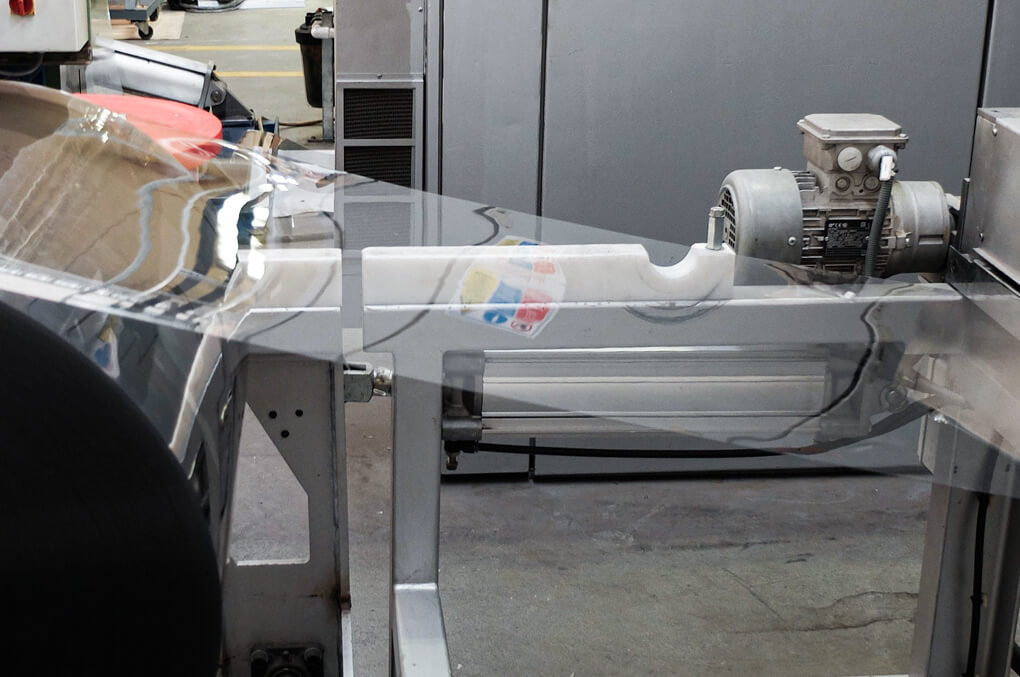
Many plastic thermoformers may say they are making their products out of recycled plastic, but still be using virgin material in the mix, which uses up unnecessary raw materials.

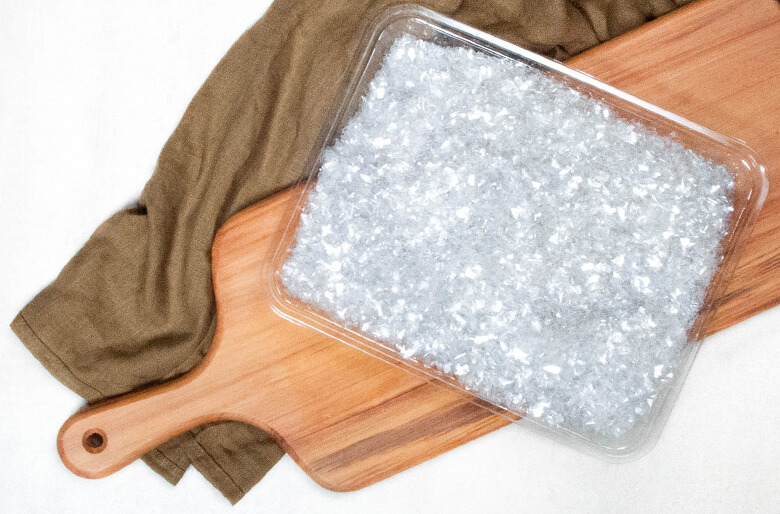
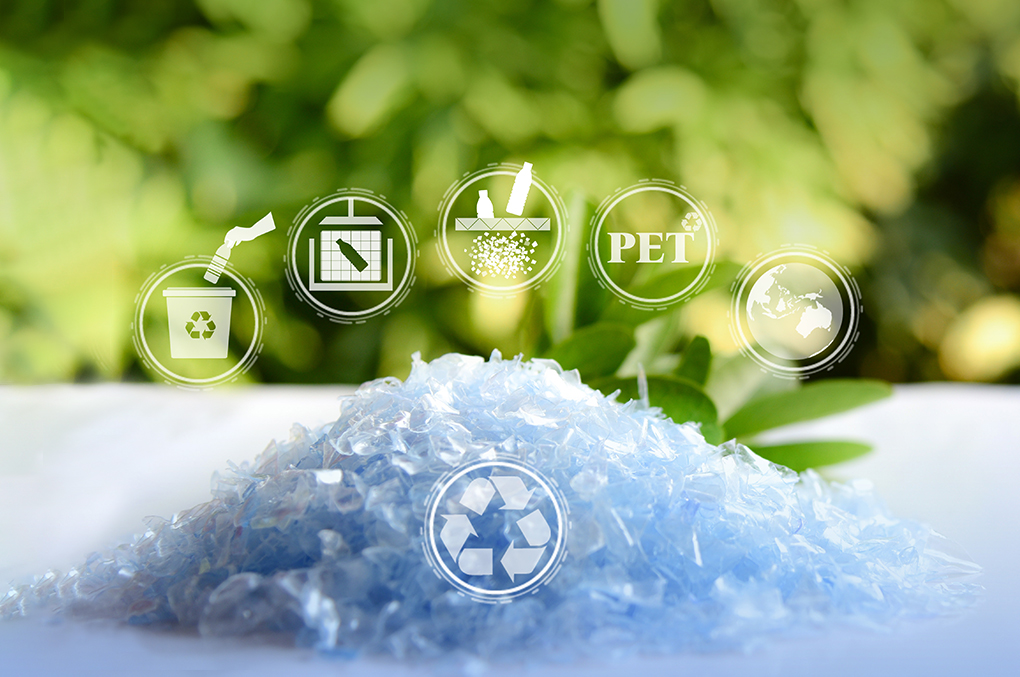
By contrast, we voluntarily use as much 100% RPET material into manufacturing plastic packaging. So as well as the fact that nearly all our products are recyclable, most of the containers we thermo-form are made from 100% recycled polyethylene terephthalate, with almost no new resin added. This commitment to honour the spirit of recycling has reduced our carbon footprint by 24% right off the bat and you cannot tell the difference when comparing our recycled products to those made of 85% RPET, except that ours will have the Custom-Pak or NZ Made logo. Otherwise, they are just as clear, hygienic and safe as those made with a blend of recycled and raw materials.

By taking responsibility for creating a more circular system, the end product of our process has become the input of raw materials to the next phase of manufacturing plastic packaging. By recycling in this way we conserve finite resources, avoid the energy use and emissions of transport and processing of raw materials, and add volume to the recycling sector, which helps make recycling as a whole more economically viable.

Clear RPET and PET usage

% Change 2023 RAW MATERIAL USAGE 2023 – KG 2022 – KG 2021 – KG 2023% 2022% 2021%
8.42% Clear RPET (100% Recycled) 1,311,058 1,138,521 1,099,812 60.53% 52.11% 64.57%
0.02% Clear RPET (100% Virgin)   513   0.00% 0.02%  
1.49% Clear RPET (80% Recycled) 372,698 343,384   17.21% 15.72%  
-9.98% Clear RPET (50% Recycled) 34,009 252,300 1,200 1.57% 11.55% 0.07%
0.06% Clear RPET (50% Recycled) Med Silicon 1,232     0.06% 0.00%  
-0.48% Clear RPET (50% Recycled) No Silicon   10,420   0.00% 0.48%  
-0.12% Clear RPET (50% Recycled) Anti Block 22,517 25,406   1.04% 1.16%  
0.00% Clear PET (50/50 Virgin/Recyclate)     7,783 0.00%   0.46%
-12.48% Clear PET (70/30 Virgin/Recyclate) 33,311 306,234 420,443 1.54% 14.01% 24.69%
12.09% Clear PET (70/30 Virgin/PCR) 261,809     12.09% 0.00% 0.00%
0.72% Clear PET (70/30 Virgin/PCR) Low Silicon 15,552     0.72% 0.00% 0.00%
0.00% Clear PET No Silicon (70/30 Virgin/Recyclate)     15,208 0.00%   0.89%
0.00% Clear RPET Anti Block (70/30 Virgin/Recyclate)     21,493 0.00%   1.26%
0.28% Clear RPET Fog (100% Recycled) 6,024     0.28%    
0.00% Clear RPET Fog (Virgin)     31,787 0.00%   1.87%
  TOTAL 2,058,209 2,076,778 1,597,726 95.02% 95.05% 93.81%

COLOUR PET, HIPS AND POLYPROPYLENE USAGE

% Change 2023 RAW MATERIAL USAGE 2023 – KG 2022 – KG 2021 – KG 2023% 2022% 2021%
-0.68% Black PET (50/50 Virgin/Recyclate) 55,693 71,069 60,851 2.57% 3.25% 3.57%
-0.13% Black PET Anti Freeze (50/50 Virgin/Recyclate)   2,800   0.00% 0.13%  
0.00% Black PET No Silicon (50/50 Virgin/Recyclate)     3,328 0.00%   0.20%
0.00% Black PET Med Silicon (40/60 Virgin/Recycled)       0.00%    
-0.14% Black PET Ultra Violet   3,000   0.00% 0.14%  
0.07% Coloured RPET 7,350 5,865 3,871 0.34% 0.27%  0.23%
0.59% White PET 18,203 5,400 2,098 0.84% 0.25% 0.12%
0.00% HIPS     1,797 0.00%   0.11%
0.31% Polypropelene 26,655 20,135  33,504 1.23% 0.92% 1.97%
  TOTAL 107,901 108,269  105,449 4.98% 4.95% 6.19%
  GRAND TOTAL 2,166,110 2,185,047 1,703,175     Â